
When working on Selenium tests, do you appreciate a traditional IDE-based approach to debugging, with a GUI that lets you set breakpoints, step through your code line-by-line, inspect variables, and evaluate expressions on the fly?
Here's a .gif to illustrate what I mean:
Have you also tried WebdriverIO (the popular library for developing Selenium WebDriver test scenarios using Node.JS), but not yet come across a way to enjoy that type of debugging experience?
Visual Studio Code is a useful, lightweight, open-source IDE with support for debugging Node.JS apps.
And it allows you to interactively debug WebdriverIO code. So, in this post I'll document how to configure VS Code as your one-stop-shop for interactive WebdriverIO debugging!
We'll start from the beginning, installing each piece of software you need - and once that's complete, we'll build and debug a WebdriverIO test in the VS Code IDE.
Let's begin!
Installing Java
Things will go more smoothly later if you first ensure you have java in your shell's PATH. WebdriverIO will expect it to be present so it can launch the Selenium standalone server (which is a Java app) for you.
So, install a JRE for your platform before going further (if you don't already have one).
The version I used when writing this tutorial was:
$ java -version
java version "1.8.0_05"
Java(TM) SE Runtime Environment (build 1.8.0_05-b13)
Java HotSpot(TM) 64-Bit Server VM (build 25.5-b02, mixed mode)
Installing Node.JS
Both WebdriverIO and VS Code will expect you to provide your own installation of Node.JS. For that, you have a few choices:
-
You can visit https://nodejs.org/ and download an installer.
-
Mac folks can use Homebrew or MacPorts.
-
Or, nvm works great as well (it allows you to install multiple node versions).
For this tutorial, I'll be using homebrew to install node. (Visit https://brew.sh/ for more info on installing homebrew.)
To install node, I ran:
$ brew install node@6

$ echo 'export PATH="/usr/local/opt/node@6/bin:$PATH"' >> ~/.bash_profile

$ source ~/.bash_profile
Check the node and npm versions you now have active - my install ended up with:
$ node -v && npm -v
v6.12.3
5.6.0
That environment will be what I use for the rest of this tutorial.
Creating a WebdriverIO Project
These steps are based on the developer guide at http://webdriver.io/guide.html, with a few small changes.
# Create a new dir for your project, with a boilerplate package.json
mkdir webdriverio-test && \
  cd webdriverio-test && \
  npm init -y

# Install WebdriverIO, and tell npm to add it as a dependency in package.json
npm install webdriverio --save-dev
Now, run the WebdriverIO config helper:
./node_modules/.bin/wdio config
It'll prompt you for a series of questions - I accepted the defaults for each, EXCEPT the Do you want to add a service to your test setup? question.
For that one, select selenium-standalone
Here's what my final settings resembled:
? Where do you want to execute your tests? On my local machine
? Which framework do you want to use? mocha
? Shall I install the framework adapter for you? Yes
? Where are your test specs located? ./test/specs/**/*.js
? Which reporter do you want to use?
? Do you want to add a service to your test setup?  selenium-standalone - https://github.com/webdriverio/wdio-selenium-standalone-service
? Shall I install the services for you? Yes
? Level of logging verbosity silent
? In which directory should screenshots gets saved if a command fails? ./errorShots/
? What is the base url? http://localhost
That will create wdio.conf.js in your current dir.
Creating a test spec file
Now create the spec dir that the config utility asked about:
mkdir -p test/specs
Then create the file test/specs/foo.spec.js with these contents:
var assert = require('assert');
describe('webdriver.io page', function() {
    it('should have the right title - the fancy generator way', function () {
        // Tell mocha this test is allowed to run for 10 minutes, so we have
        // sufficient time for debugging.
        //
        // Note you can also set this globally in mochaOpts in wdio.conf.js:
        this.timeout(10 * 60 * 1000);

        browser.url('http://webdriver.io');
        var title = browser.getTitle();
        assert.equal(title, 'WebdriverIO - WebDriver bindings for Node.js');
    });
});
To see if all is well, run the following command to launch your test - you should see a browser launch, and eventually a passing result will be printed:
$ ./node_modules/.bin/wdio

․

1 passing (10.00s)
Debugging with VS Code
If you haven't installed VS Code yet, please do so now :)
(The version of VS Code I used here was 1.20.0.)
Use the File > Open menu in VS Code to open the webdriverio-test directory you created earlier.
launch.json configuration
Now, let's create a launch.json file and add a configuration for debugging your test spec.
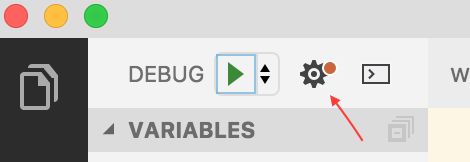
To do that, click View > Debug or the debugging icon in the left of the IDE:

Then click the small gear in the debug menu to open launch.json:
Click Node.js in the menu that appears - this will open a boilerplate launch.json.
Delete the contents of launch.json, and insert the following text:
{
    "version": "0.2.0",
    "configurations": [
        {
            "type": "node",
            "request": "launch",
            "protocol": "legacy",
            "address": "localhost",
            "port": 5859,
            "timeout": 20000,
            "name": "WebdriverIO",
            "runtimeExecutable": "${workspaceRoot}/node_modules/.bin/wdio",
            "windows": {
                "runtimeExecutable": "${workspaceRoot}/node_modules/.bin/wdio.cmd"
            },
            "cwd": "${workspaceRoot}",
            "console": "integratedTerminal",
            // This args config runs only the file that's open and displayed
            // (e.g., a file in test/spec/):
            "args":[
                "--spec", "${relativeFile}"
                // To run a specific file, you can use:
                //"--spec", "test/specs/foo.spec.js"
            ]
        }
    ]
}
Enable debugging in wdio.conf.js
Open the wdio.conf.js in the editor. (It should be in the root of your project.)
Just under the exports.config = { line, add these lines:
    debug: true,
    execArgv: ['--debug=127.0.0.1:5859'],
This allows VS Code to connect to the wdio runner for debugging.
If you forget this step, the first time you try to debug the IDE will likely show you the error message: Cannot connect to runtime process
First run
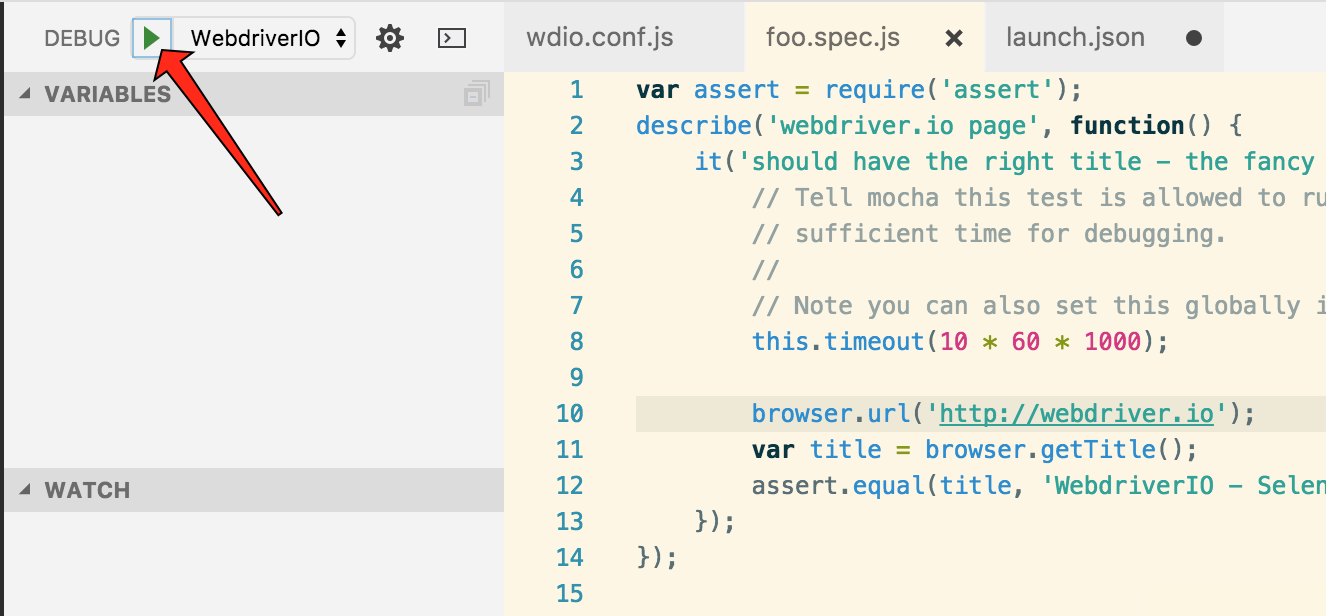
Now it's time to run a test! Open the test/specs/foo.spec.js file in the IDE, and make sure it's the active tab in the editor (so that the file name will be what the IDE plugs into ${relativeFile} in your debug config in launch.json).
Now click the green play button next to DEBUG in the IDE. You should see your test run to completion, since no breakpoints are set.
Setting a breakpoint
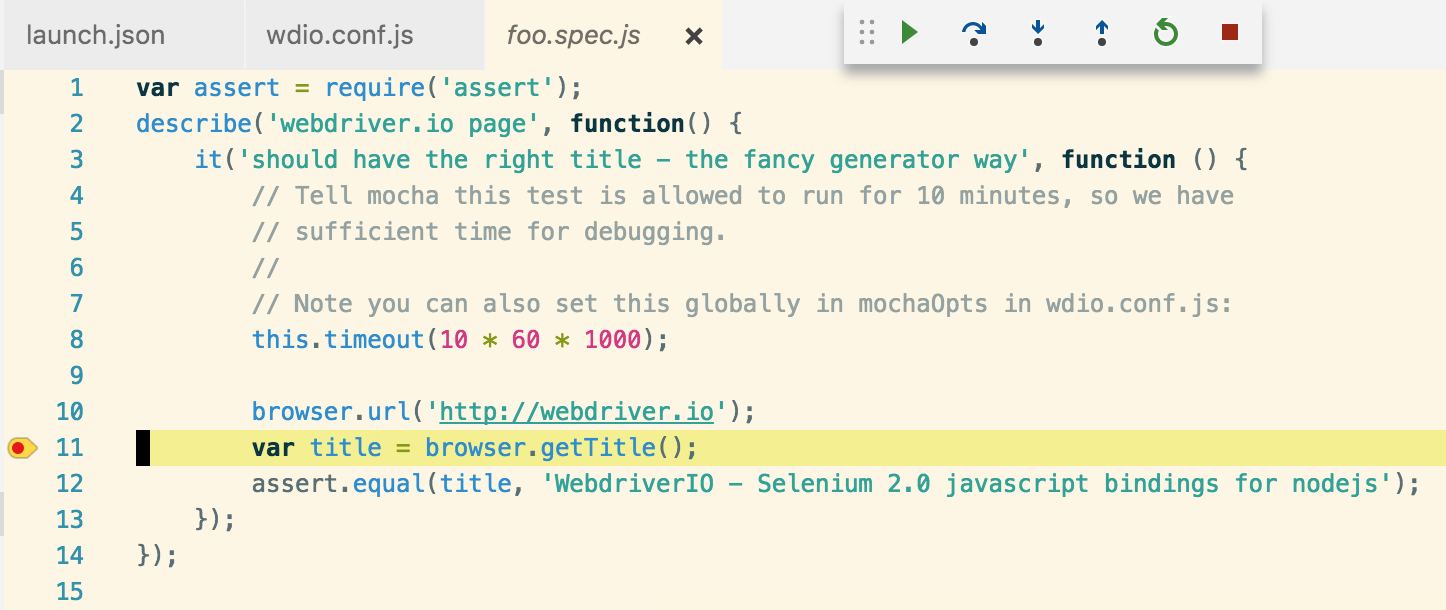
Now place a breakpoint in foo.spec.js, at line 11, by clicking the gutter to the left of the line number (you'll see a red dot appear).
Then press the debug button again and watch the IDE stop execution at line 11, as shown here:
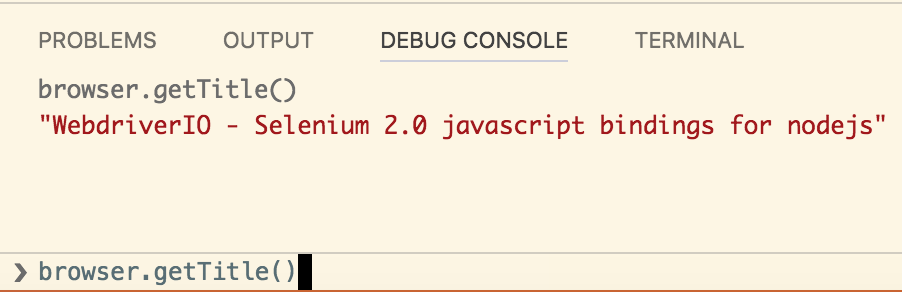
Click the DEBUG CONSOLE menu, click the small prompt box at its bottom, and experiment with adding JS statements - for example:
browser.getTitle()
That should print the browser window's title as shown here:
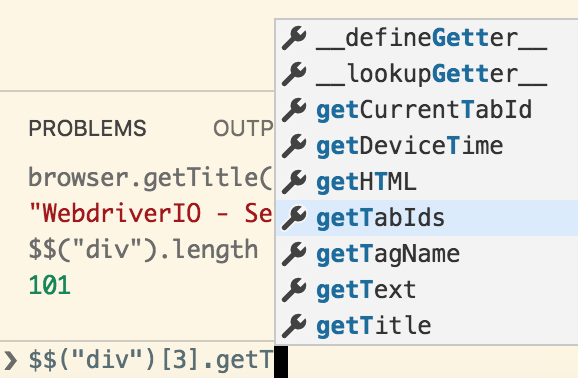
Now try inspecting elements interactively with the $ and $$ WebdriverIO helpers - for example:
$$("div").length

$$("div")[3].getText()
Note that code completion works here! It comes in handy when guessing at the first few characters of functions you suspect might exist:
That's all for now!